More on theory and metatheory in EA
“Yes, we need theory in enterprise-architecture”, people will often say to me, “but which theory should it be? Should it be quantitative, everything defined in terms of metrics? Or should it be qualitative, and forget about metrics entirely? Which one are you saying it should be?”
I can understand the reasoning behind those questions – and they came up a fair few times in response to the previous post ‘Theory and meta-theory in enterprise-architecture‘. Unfortunately, they’re the wrong questions to ask – or rather, they’re questions that cannot be meaningfully answered one way or the other.
The crucial point here is that it’s not an ‘either/or’ between quantitative and qualitative, it’s always a ‘both/and’, qualitative and quantitative together – always. In EA practice, we need always to be thinking about the appropriate mix of qualitative and quantitative for any given context – not one or or the other.
Remember what I said in the previous post, that what we’re dealing with here is recursive and fractal? In EA, quantitative and qualitative interweave with each other, and each incorporates the other within aspects of itself, much as in the classic yin-yang symbol:
The yin-yang symbol shows the interweaving, but only the first aspects of the recursion – the black dot inside the white main region, the white inside the black. In reality – and perhaps especially in EA – what we’re dealing with is at least as fractal as this tree:
Note too that, like the tree, it’s a true fractal that we’re dealing with: not the simple repetition of identicality that we see in recursive program-code, but self-similar, essentially the same overall pattern repeating, but different in fine details every time – every instance as its own mix of same and different, both at the same time. And, like the tree’s equally-fractal root-structure, much of the whole of an enterprise and its architecture is hidden from our view, unless we know that it’s there and that we need to look for it.
As Nick Malik indicates in his post ‘Moving Towards a Theory of Enterprise Architecture‘, we need something that can give us a handle on all of that difference that we see across the entire enterprise-space. Yet if we try to do it with too simple an hypothesis, we’ll find ourselves excluding from view much of the information that we actually need in order to make sense of a context – the classic ‘can’t see the forest for the trees’, for example.
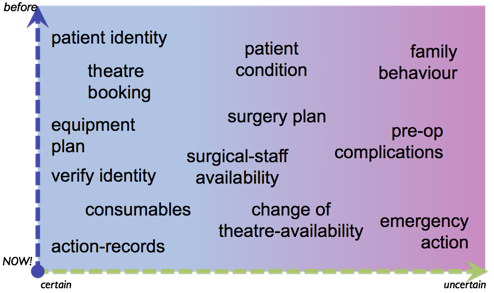
Hence what I’d typically do these days is use not so much a prepackaged framework – because again those tend to filter the view too much into their own rigid terms – but a metaframework that’s designed to self-adapt with those differences whilst still providing enough of a ‘sameness’ to support meaningful comparisons. For example, we can use the SCAN frame to map the elements of a context in terms of how distant in time they typically apply relative to the ‘NOW!‘, the moment of action, and how certain or uncertain they are:
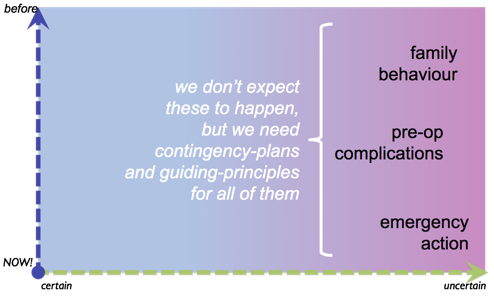
For example, some while back I showed a worked-example of a SCAN mapping for a surgical-operation within a hospital’s operating-theatre:
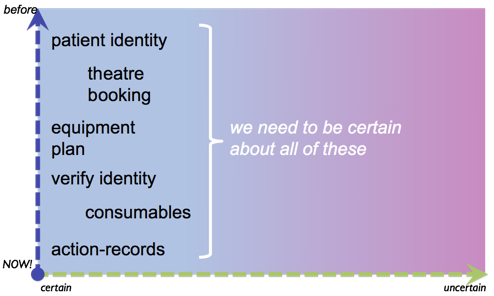
And then reclassified that set of elements in terms of what either is or needs to be most-certain:
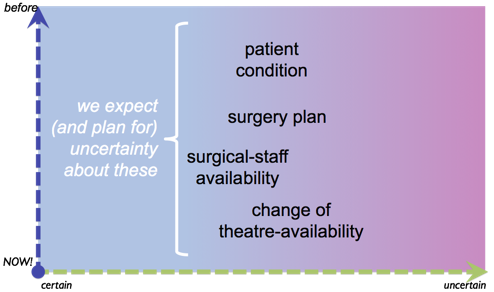
…what either will inherently be somewhat-uncertain, or that needs to adapt to some level of uncertainty:
…and concerns that are unlikely but for which we need protocols and some preparation:
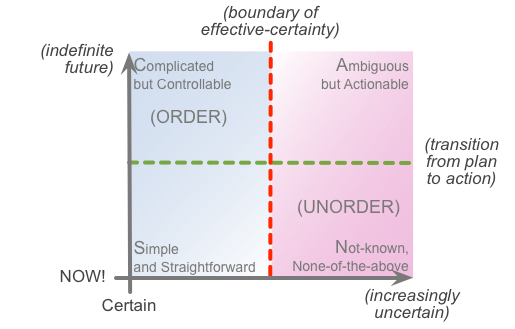
In that specific example, I used a three-way horizontal split, with only an implied categorisation relative to time-before-action – the vertical-dimension in SCAN. For simplicity’s sake – though not required – it’s more usual to split the SCAN frame into a simple two-by-two matrix, which also allows us to map out the typical tactics or methods that we’d use for concerns that centre within the respective ‘domain’:
(I’ll explain that point about different techniques in different domains in more depth in another upcoming post – as will be explained in that post, that mapping is actually as recursive and fractal as the frame itself.)
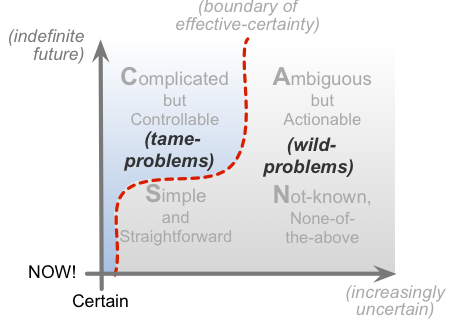
Given that mapping, we can then also map the kinds of techniques that work well with ‘tame-problems’ versus ‘wild-problems‘, which gives us a cross-map that looks like this:
Which in turn provides us with a means to identify where to focus on quantitative-techniques, where we need to mix quantitative with qualitative, and where we probably can’t use quantitative at all. The key criteria are pretty straightforward:
- quantitative-techniques depend on sameness – because if it’s not ‘same’, there’s no way to do a like-for-like comparison
- in tame-problems, sameness predominates – in fact is why they are tame-problems
- in most cases, quantitative-techniques are well-suited to tame-problems
- in most cases, quantitative-techniques are not well-suited to wild-problems
Yet because of the fractal nature of the context we’re dealing with, not only is there always some element of disruptive difference hidden away even in the most ‘tame’-seeming problems, so also are there always some elements of sameness within difference – which means that there usually are ways in which we can usefully employ some kind of quantative metrics even within some seriously-‘wild’ contexts.
An example of this in my own work is the SEMPER diagnostic, which tackles the always-problematic issues around power and responsibility in the workplace. We start by noting a key distinction:
- a physics definition of power is ‘the ability to do work’
- many social definitions of power are more like ‘the ability to avoid work’…
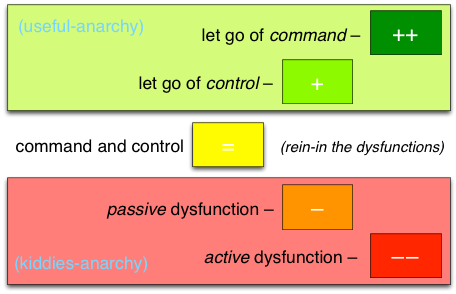
Once we understand that point, we can then map out the impications. I won’t go into the detail here – there are some aspects of it described in the post ‘RBPEA: On power and gender‘ – but for this purpose, we can just note that in effect it gives us a kind of five-point scale from most-dysfunctional (destructive-competition, ‘prop self up by putting other down’) to most-functional (self-commitment, ‘wholeness-responsibility’):
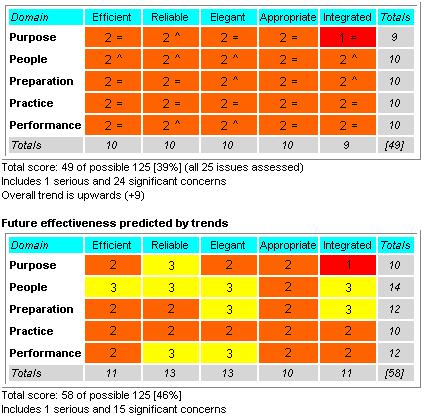
The scale alone doesn’t tell us much, of course. But if we then combine that scale with a means of scoring the respective ‘ability to do work’ within a consistent set of elements of a context, what we end up with is a quantitative description of a qualitative concern – such as in this real example of the use of that diagnostic, in a ‘before-and-after’ pairing:
In that specific context, the company was losing money pretty badly at the start of the engagement, with almost-universally poor performance everywhere, as shown in the upper dashboard; six months later, the team had shifted the culture enough not only to give the noticeably-better results as per the lower ‘trends’ dashboard, but the company had turned back into profit again. (Disclosure: I only did the mapping, not the consultancy-engagement itself – I can’t claim any personal credit for that turnaround!)
There are, however, a few points we need to note about this.
One is that the company turned round into profit even though its ‘ability to do work’ was still pretty low by any reasonable-seeming standard. Our experience with this is that companies can be profitable with a score even as low as around 40-45% – as in this example – which, although a bit depressing in some ways, does mean that the bar for ‘success’ is actually quite a lot lower than we might expect.
Another point is that we need to remember that whilst this gives a quantitative score that’ll keep MBA-style managers happy, it’s still a qualitative issue, not a simplistic count-the-numbers-and-hit-the-target quantitative one. If we ever forget that point, we’ll likely find ourselves in even worse trouble than that with which we started…
The other point is to take care not to be distracted too much by the numbers: they’re just sort-of-useful numeric indicators for what are actually qualitative concerns. For example, each of the ‘3’-level responses shown in the lower ‘trends’ represents something that we could perhaps leverage elsewhere – typically in the same ‘row’ or ‘column’ as shown on the grid. The number itself doesn’t tell us this: knowing what the number represents is what does.
And notice that ‘1’-result – ‘active-dysfunction’ – up in the upper-right corner of the grid: it still hasn’t gotten any better in the ‘after’ dashboard – and yet any ‘1’-level concern could bring the entire organisation down, by ‘infecting’ other aspects of the organisation’s operations. It’s crucially important that this should be addressed – and yet we can’t tackle it head-on, because doing so with a ‘1’ will always make things worse. Instead, we need to leverage something else in either the same ‘row’ or ‘column’ – respectively ‘Purpose’ or ‘Integration’ for that problem-area, in this particular version of the diagnostic – and use further work on that domain to ‘counter-infect’ the problem-area. (Again, a full explanation on that is something for another post.)
Enough on that for the moment: the point is that we can mix qualitatives and quantitatives together wherever we need to do so.
Yet since every instance of that kind of mix is context-specific, and the overall theory and method is somewhat context-specific, we need some form of metatheory to hold it all together, and guide how we select and build theory for specific EA needs. In effect, we have a recursive matrix here:
- method guides practice
- methodology guides method
- theory guides methodology
- metamethodology guides theory
- metatheory guides metamethodology
…and in turn:
- practice informs method informs methodology informs theory informs metamethodology informs metatheory
And so on towards metametamethodology, metametatheory and metametaframeworks – though in practice we could probably stop there. 🙂
The key takeaway from this, though, is that for EA, theory alone is not enough – not least because it tends all too easily to lock us into a ‘tame-problem’ approach to everything, which is Not A Good Idea for real-world practice. Instead, what we need most in EA is solid metatheory – theory-of-theory – because once we have that in place, whatever we need of theory (and just about everything else) will tend to fall into place almost by itself.
In short, it’s true that we do sort-of need ‘the theory of EA’, yet it’s a very specific type of theory that we need, typified in part by the practical guidance of themes such as those in ‘the enterprise-architect’s mantra‘: ‘I don’t know‘, ‘It depends‘, and ‘Just Enough Detail‘. The proper term for that ‘very specific type of theory’ is metatheory: and getting a solid handle on what that really is for EA, and how to teach it to others as need be, is, I believe, what would at last provide some means to change our ‘trade’ from its present undisciplined, unfocussed, randomly-hijacked mess into the proper profession that it so urgently needs to be.
Leave it at that for now: over to you for comments, perhaps?



Should we accept ST as a metatheory?
Thanks,
AS
I’d say that much of ST (assuming you mean systems-thinking?) would fit in more with metatheory than theory, yes.
The key distinction is that metatheory is theory that is or can be applied to itself – theory-of-theory. That’d be true of quite a lot of ST and related domains, though probably not all.
(The exact analogy is that a metamodel is a model that is used as a base for other models, and to validate those other models – i.e. model-of-model.)
Sure.
Imagine the following metamodel (based on the ST) for EA:
– all artefacts (types of component) are versionable throughout their life-cycle
– all artefacts are evolved to become digital, externalised, virtual and located in clouds
– all relationships between these artefacts are modelled explicitly
– all models are made to be executable (actionable)
– find the system-forming artefact(s)
– provide techniques how to derive other artefacts from the system-forming one(s)
– guarantee that different people in similar situation find similar system-forming artefacts (thus avoiding silos)
– consider stakeholders and explain to each group of stakeholders
• artefacts under their control
• relationships under their control
• how to address their concerns
– enable changes at the pace of the business
Potential candidate for a system-forming artefact is business process – “Enterprise as a System Of Processes” – http://improving-bpm-systems.blogspot.ch/2014/03/enterprise-as-system-of-processes.html
What do you think?
Thanks,
AS